Fixed: The MACD Indicator
Traditionally, it's pretty bad. Good thing I fixed it for you.

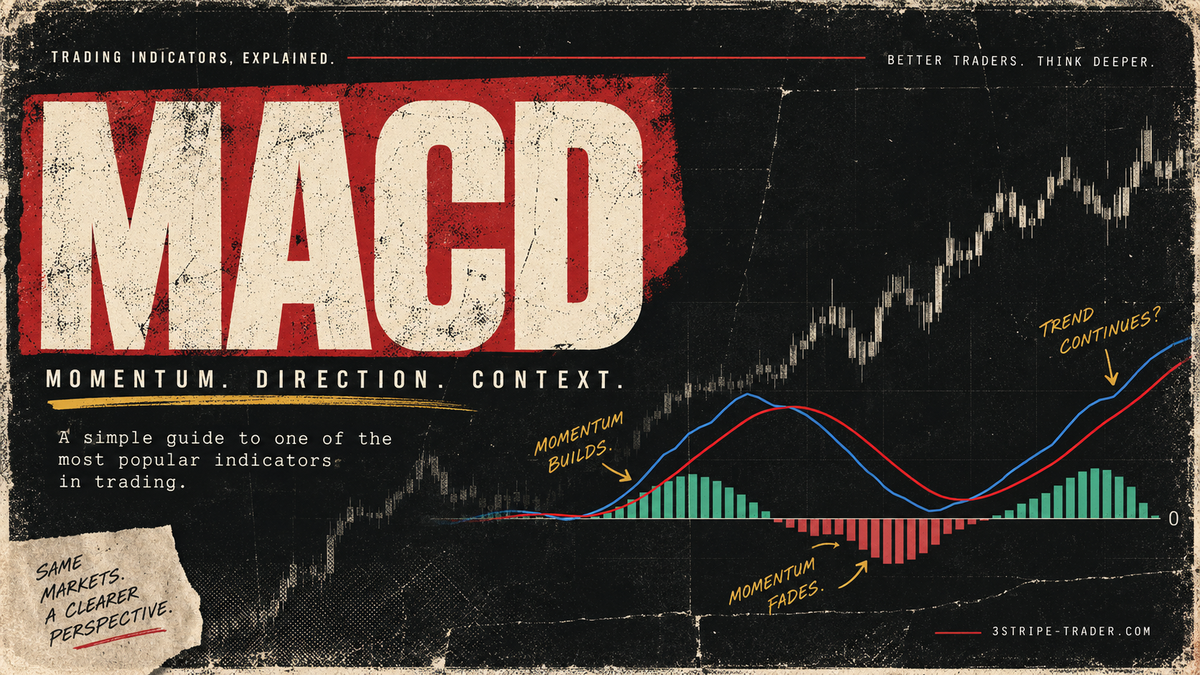
It was the best of times, it was the worst of times...and no, this is not the beginning of a lengthy novel philosophising about the MACD indicator. This is all about raw-hard facts, and if you've ever wondered if you're throwing trades into a hole of no return using this indicator blindly, I'm here to tell you - you have.
But let's first get the obvious things out the way...what the heck is the MACD indicator? Well, the MACD (Moving Average Convergence Divergence) is a momentum indicator that helps you see whether a market is gaining or losing momentum.
At its core, MACD compares two exponential moving averages:
Fast EMA: 12 periods
Slow EMA: 26 periods
A MACD line: the 12 EMA - 26 EMA
A Signal line: the 9-period EMA of the MACD line
You don't really need to calculate any of this yourself. Your charting platform does the maths for you. Have a look at it below (generously created by our A.I friends):
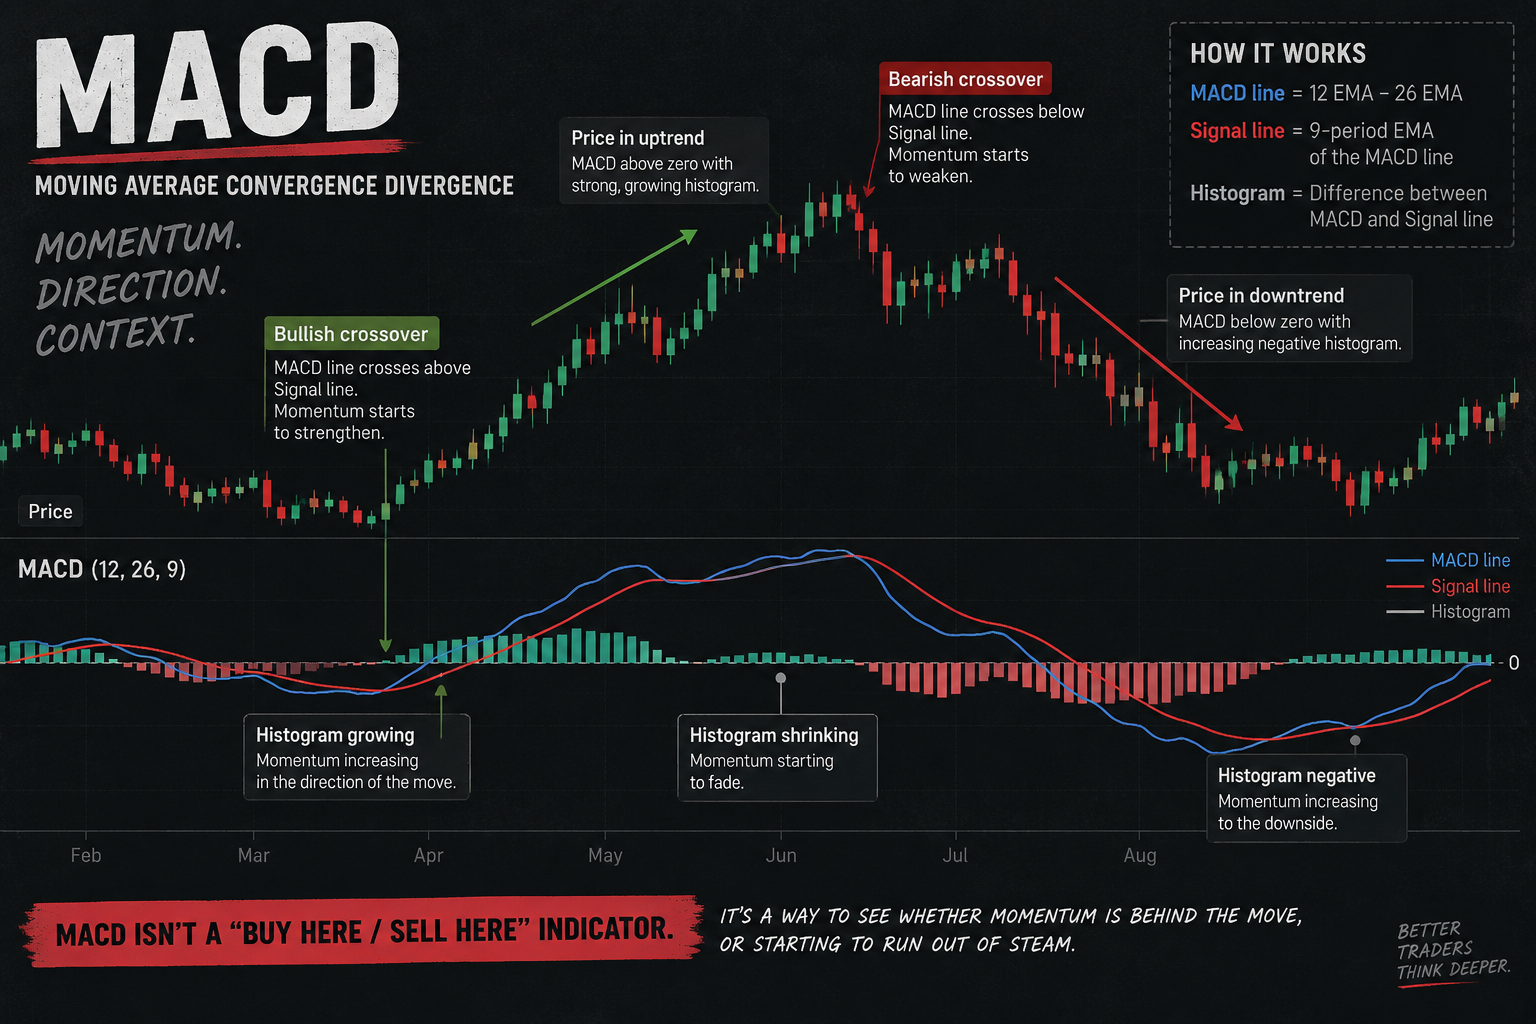
Ok fine, so those lines are really pretty, but how do you use them exactly? The prevailing theory is that when the MACD line moves above the Signal line, momentum is generally strengthening to the upside. Most traders would take this as a "buy" signal, and start subjectively analysing where to put their long position stop losses. You could also run on over to YouTube, and find the best MACD setups there where you'll make thousands of dollars a day using this indicator out of the box. So why then isn't everyone a millionaire? I'm about to tell you...
The success of this indicator is directly correlated (like most strategies and indicators), to the prevailing market conditions, sentiment, momentum and classification. Used in isolation, you're basically driving a car with painted windows, and hoping you reach your profit target before you hit a tree.
Using a very simple setup, we can see it in action (or non-action) with popular pairs like Bitcoin and Ethereum against the USDT token. Taking a most-recent low for our stop-loss placement for long positions (and a most-recent high price for our stop loss placement for short positions), these were the findings:
Bitcoin
| Timeframe | CAGR % | Max Drawdown | Total Trades |
|---|---|---|---|
| 15 min | -100% | -100% | 9842 |
| 30 min | -95.3% | -100% | 4752 |
| 1 hr | -100% | -100% | 2329 |
| 4 hr | -26.7% | -67.7% | 554 |
| Daily | 2.7% | -22.0% | 86 |
Ethereum
| Timeframe | CAGR % | Max Drawdown | Total Trades |
|---|---|---|---|
| 15 min | -100% | -100% | 9863 |
| 30 min | -97.8% | -100% | 4709 |
| 1 hr | -59.8% | -98.9% | 2333 |
| 4 hr | 14.0% | -20.8% | 567 |
| Daily | 6.9% | -5.0% | 94 |
It was also encouraging to see that Ethereum performed differently to Bitcoin, and even profitably in certain timeframes, showing the different market conditions and behaviours owned by each of these markets and their personalities. For interest, the 14% annual return on the 4 hour timeframe was using a 1:2 R:R ratio.
But, I think we can do better...
Let's look at the worst-performing timeframe - the 15 minute chart. Simply applying some market awareness around when we trade, we're able to identify periods in time where using only the MACD can yield much better returns. Unfortunately, the exact parameters of these "classifications" are restricted to member-only access at hello-finn.com, but I am able to share the results (verbatim) from the dashboard for your enjoyment.
Bitcoin (15 min) - Optimised
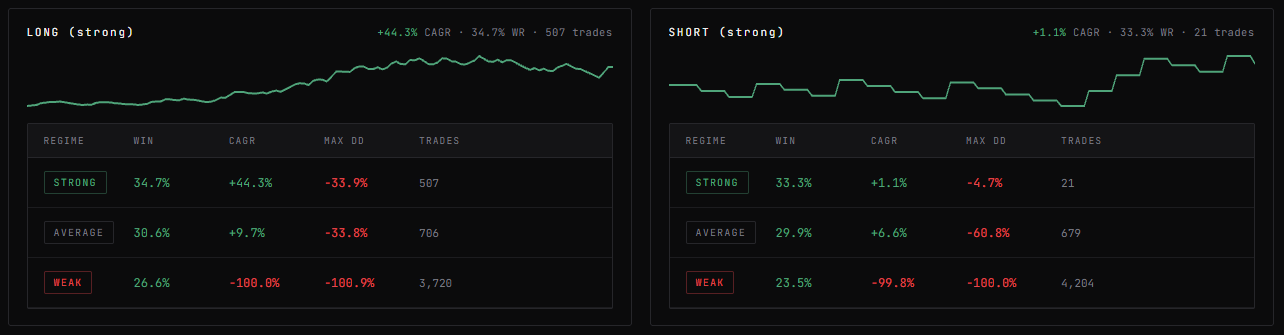
Incredibly, by taking fewer trades and observing the market conditions before blindly trading, you're able to boost your returns from effectively losing everything to a +22.7% average annual return between the long and short positions. Incredible. The picture looks similar for Ethereum:
Ethereum (15min) - Optimised
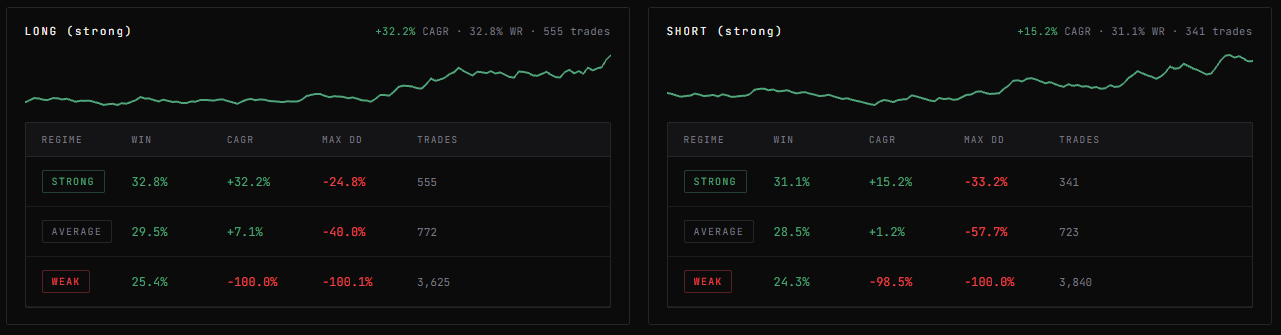
Obviously the conditions for these market classifications, along with their notifications when they occur, are for the members at hello-finn.com, but it definitely feels good to share these openly finally. You can grab access to these results, the conditions, and the backtest results yourself by visiting hello-finn.com yourself.
As always, if there is anything extra you'd like to see included, you know how to get in touch.
Build smarter portfolios, cut through the noise, and improve your trading success with Finn.